Ambiguous Bills and Anonymous Commentators: Reflections on My Experience Transcribing the Bills of Mortality
by
Laszlo Taba
2024-09-10I have had the pleasure over the last several months of transcribing Bills of Mortality for the Death by Numbers team, and what initially most surprised me is the amount of interpretation my role requires. Just because the bills are what historians would describe as “primary sources,” transcribing them is more complicated than just copying them word-for-word.
While it helps that the original bills are in English, I still routinely run into textual issues that require me to pause and think carefully and critically about how to approach the text. In this blog post, I want to give readers a peek into my world, so they can see the transcription issues I face on a regular basis. Before I end, I will offer a brief list of strategies I have learned that have helped me tackle transcription issues. I will also challenge you, dear reader, with three recent examples from my work to test your mettle as a transcriber. I encourage you to reply to this post with your ideas about how you would deal with them.
Recently, I had the pleasure of presenting original research and maps about early modern death at the 2024 American Historical Association in San Francisco. I showcased maps between 1656 and 1680 based on general bill data. That span of years offered interesting data to showcase, including the major plague outbreak in London in 1665 and the Great Fire of London a year later in 1666. But how did I actually map these years?
As Death by Numbers has evolved and developed, there have been some slight changes to our workflow, which caused us to reconsider how to work through and present our data. One of those shifts came about because we set up our workflows using early 18th century bills as a model, before shifting to work with the bills from the mid and late 17th century.
As a team, we quickly realized that the older bills were falling apart and had more missing information than the bills produced later. This caused some issues in our workflow, however, because previously we were using Datascribe’s ‘is missing’ marker for parishes who did not report any death information from that week. This was because the longer the bills were printed, the less reliable they became, especially by the 1700s. When we started, we felt our original method was a reasonable way to denote possible unreported deaths. However, when looking at bills that were literally missing sections due to degradation, we had to reevaluate how to use that flag. This new use was much simpler: only using ‘is missing’ flags when parishes were literally missing from the bills (usually because they didn’t exist yet), and use a combination of the ‘is missing’ and ‘is illegible’ flags for the parts of the page that are nonexistent and affect the readability of the data.
We are in the process of building out a data API to support the data work we’re undertaking with the transcription of the plague bills. We anticipate hundreds of thousands of rows of data by the end of our transcription process, and we wanted an easy and efficient way to work with that data.
As part of our work in data-driven historical research at RRCHNM, we are building a data API to store and access data from databases. Following the process of transforming the DataScribe transcriptions into tidy data, the resulting data is uploaded to a PostgreSQL database where we can take advantage of relational connections among the different datasets we’ve compiled.
One of the ways we are using the transcribed bills of mortality is in data visualization and mapping, in an effort to ask new questions and revisit old ones.
At the Southern History Association’s annual meeting in Baltimore, we presented preliminary work on data visualization and the data API. An interactive notebook on this early work is available on Observable for perusal (note, the page may take a moment to load the 100,000+ records). You may also make a copy of this notebook to your own Observable account to edit.
Figure 1. Bills of Mortality Workflow.
Once items are added to DataScribe and the datasets are ready for transcription, the transcription workflow begins. The project owner can assign users one of two roles: reviewer or transcriber. Reviewers can edit all records and items, regardless of the item’s status. For Bills of Mortality, Reviewers include the staff members on the project and our Digital History Research Assistants. Transcribers can only edit records and items which are locked to them. The Bills of Mortality transcription team is made up of undergraduate and graduate students.
In our last post, we explained how we used Tropy to organize photographs of bound bills into items, concluding with the export of the item metadata using the Tropy CSV Export plugin. This post covers the other part of the process of going from digital images to items in a datascribe item set. If you look at the workflow image, we’ll be describing work that takes place in the “Image Processing and CSV Creation” and “Omeka S Item Creation” areas.
Have you ever wondered how a complex project like Death by Numbers comes together? This post is the first in a series about the workflow that takes us from archival sources to transcriptions formatted for computational analysis. Let’s begin with digitization.
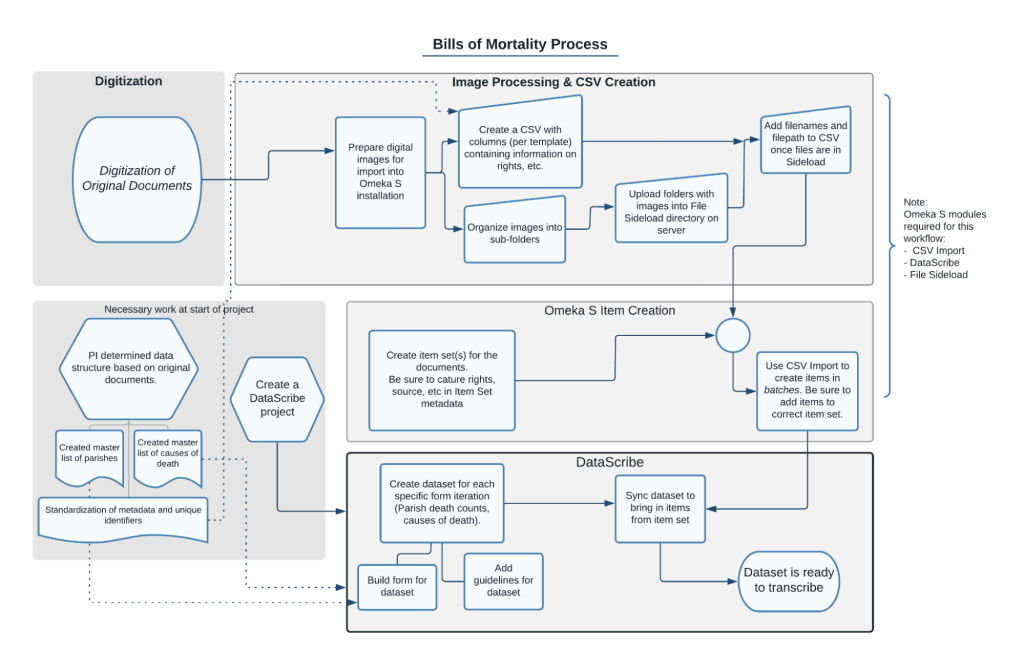
Figure 1. diagram of image preparation workflow showing process from digitization to image processing and CSV creation to omeka s item creation to datascribe transcription.
So you want to start transcribing data from historical documents? The task seems easy! However, there are quite a few issues that can pop up which can create problems for other parts of the project. Below are some of the expected errors our transcribers on Death By Numbers frequently run into and some tips on how to handle them. The job may sound intimidating with all the potential pitfalls, but we have suggested solutions from all the tips and tricks our team has picked up over the past few months.